15 March 2019
Bob Cunneen, Senior Economist and Portfolio Specialist
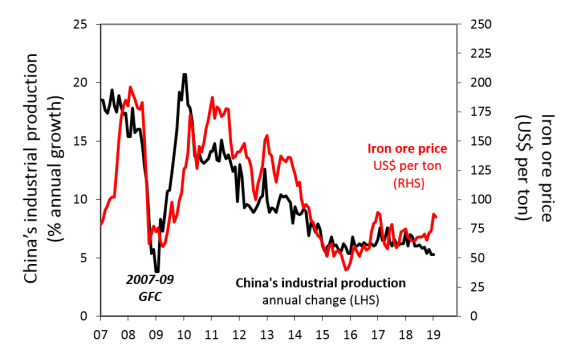
China’s production vs iron ore price
Source: Datastream.
China’s recent economic growth performance has been remarkably stable. China’s industrial production has been running smoothly between 5% to 7.5% annual growth over the past three years (blue line). This is astonishingly resilient considering that the Chinese central bank had been tightening credit conditions to constrain debt growth. President Trump’s ‘trade war’ on Chinese exports over the past year should also have significantly curbed production growth.
However two recent academic studies* have highlighted concerns that China’s economic growth is significantly less than the government’s data. These studies examined a range of growth measures such as government tax revenues, railways cargo volumes and even satellite images of lighting activity at night to estimate China’s actual growth rate. Notably these studies suggest that China’s annual economic growth is between 1.7% to 3.4% less than the government’s data.
These dim sums on China’s growth could prove to be a harsh reality check for Australia. Slower Chinese growth has important implications for our key commodities such as iron ore, coal and gas. Having spent enormous sums during the mining investment boom to boost our production capacity to meet China’s demand, has Australia overstated China’s potential appetite for our commodities? If so, then a slower China growth profile could suggest considerable downward pressure on future iron ore prices (red line).
* Academic papers:
‘A forensic examination of China’s national accounts’, Brookings Papers on Economic Activity, 7 March 2019,
brookings.edu/bpea-articles/a-forensic-examination-of-chinas-national-accounts/.
‘Illuminating Economic Growth’, John Hopkins University, 11 December 2018, econ2.jhu.edu/people/hu/paper_HUandYAO.pdf
Source : Nab assestmanagement March 2019
Important information
This communication is provided by MLC Investments Limited (ABN 30 002 641 661, AFSL 230705) (“MLC”), a member of the National Australia Bank Limited (ABN 12 004 044 937, AFSL 230686) group of companies (“NAB Group”), 105–153 Miller Street, North Sydney 2060. An investment with MLC does not represent a deposit or liability of, and is not guaranteed by, the NAB Group. The information in this communication may constitute general advice. It has been prepared without taking account of individual objectives, financial situation or needs and because of that you should, before acting on the advice, consider the appropriateness of the advice having regard to your personal objectives, financial situation and needs. MLC believes that the information contained in this communication is correct and that any estimates, opinions, conclusions or recommendations are reasonably held or made as at the time of compilation. However, no warranty is made as to the accuracy or reliability of this information (which may change without notice). MLC relies on third parties to provide certain information and is not responsible for its accuracy, nor is MLC liable for any loss arising from a person relying on information provided by third parties. Past performance is not a reliable indicator of future performance. This information is directed to and prepared for Australian residents only. MLC may use the services of NAB Group companies where it makes good business sense to do so and will benefit customers. Amounts paid for these services are always negotiated on an arm’s length basis.


